Categorieën
Uncategorized

Social Media Fatigue?

Do I suffer from Social Media Fatigue? Returning back from holiday I looked at a number of new followers on Twitter and they are all companies. They are following me to sell me stuff but I cannot imagine  they will ever make a sale. How is it possible to be interested in the lives of more that 500 followers, where does one find the time to read all these tweets? It is common knowledge that people on Facebook want to depict themselves as uber-happy and successful. Sharing a location on foursquare has not brought me any value but only costed me time. Not to mention the nice integration between social media platforms causing the same small post to appear in a number of timelines at once. In the end there are some tweets, wall posts or others that add value but ask yourself:

Is the percentage of consumed social media information that add value higher than 1%?

Why not direct your energy away from social media and towards a rewarding goal?

I like to believe that if we would have directed all the the human energy used at Social Media worldwide, we might have realized at least one of the Millennium Goals of the United Nations.

Categorieën
Uncategorized

Why relevancy has been and always will be important

Today I read a nice post by Sander Duivestein on Frankwatching titled “The Future of Information: realtime becomes right time”. Providing information at the right time has always been more important than realtime information. Relevancy is the third barrier to information productivity and organizations are coming closer to this barrier. These organizations have made information available (barrier #1) and accessible (barrier #2).

Sander argues that time and attention are scarce goods and that today technology is aware of our context. Well the first argument has been the case since the beginning of time itself. No matter how hard we try there will only be 24 hours in a day of which we can be engaged for maybe 10 to 12 hours maximum. The same can be said for attention. Our brain can focus on one activity or a number of activities. When we are focussed on one activity we ignore everything else. When we focus on a number of activities the quality of all activities will decline. The more activities we try to do the less quality we will produce. The Monkey Business Illusion offers great insight in attention.

[youtube http://www.youtube.com/watch?v=IGQmdoK_ZfY]

The second argument is that technology is finally aware of our context. Of course the world is not black and white and technology was already partly aware of our context, personalization has been part of technology for a number of years. What has changed is that technology is moving tot a 1 on 1 personalization and is combining all available input. This enables algorithms to assess what a person is doing each time of the day. The most promising initiatives at the moment, Siri and Google Now & Glass, are all aimed at the consumer market. Is there a need for an initiative in the consumer market or will consumerization of IT take these consumer initiatives to the office?

For a feel of the power of Google Now and Glass, take a look!

Google Glass

[youtube http://www.youtube.com/watch?v=9c6W4CCU9M4]

Google Now

[youtube http://www.youtube.com/watch?v=pPqliPzHYyc]

Categorieën
Neuroscience

Dick Swaab at EIM2012 on Brains and Information

Yesterday at EIM2012 the honorable mister Dick Swaab gave a presentation on the Brain and its impact on our character and our behaviour. His message was that we cannot change very much about who we are because this is formed in our brains during pregnancy (he appealed for a ban on smoking, drinking and drug use during pregnancy) and just after birth.

But what does this mean for information processing. I can imagine we actually cannot change very much in our capabilities for information processing. The only real way is to add neurotransmitters, for instance oxitocin to increase trust and reduce fea, to change the way we process information and make decisions.

We can be more aware about the way we present information to our brain. Our senses are wired to our brain differently and our eye’s perform best, this means that listening is slower to supply information to our brain than reading. So an audio book is a great way to ‘read’ a book in your car but will take a lot longer and possibly the listener has a lesser recall.

Another way is for the sender to prime a reader better or avoid priming. For instance in the way we present options. The first option always prime your response to the second and so on. A response to a question primes the answers of others. The sender of information can think of ways to prime the receiver in word choice, options and context in which the information is received. The receiver would want to avoid priming as much as possible the make a more conscious decision.

Evoking the conscious/rational mind to process information instead of the subconscious or system 2 over system 1 if you have read Daniel Kahnemann. Our rational thoughts are lazy and remain dormant as long as possible but can be enabled. One trick is to make text a little fuzzy and therefor harder to read. This requires more attention and turns on your ratio!

Conclusion is that our brains cannot be changed for information processing but the context of information and the information itself can be presented in a smarter way to enable better processing. This requires more understanding of the way our brains work by sender and receiver of information to start using these insights!

Categorieën
Neuroscience

Great TED video by Daniel Tammet: Different ways of knowing

For me this video is about the power of association in the brain!

Categorieën
Uncategorized

Three Forms of Transparency


I think there are three forms of transparency: forced, active and passive. The first, forced transparency, is well know because of cases like Enron and Wikileaks. Legislatorsand society force organizations to be open about the way they operate. Organizations are forced to be accountable and more importantly to do the right thing. In to many cases organizations were doing wrong and nobody could see until it was to late. People have lost their lifesavings or a in dept for the rest of their lives no matter how hard they work because of the lack of transparency by some organizations.

The second form is active transparency were companies open up to supplies and customers to directly create value. Logistics companies offer a permanent view on their process to track and trace deliveries. Car manufacturers offer their customers the possibility to change features of a car while it is build. A parts manufacturer has direct access into inventory levels of their customer to know how much and when they need to ship new parts. An insurance agent can get quotes from insurance companies in realtime to advise their clients better.

The third form of transparency is passive. An organizations can only create value indirect with this form and does not play an active role. Consumers around the globe are rating all sorts of products and services on the internet. They rate the quality of a medical doctor or a book, they rate a company or a movie. If there is no platform (ie a comparison site or a forum) to do so, it is very easy to create one or just go to Facebook. These ratings are made whether an organization likes it or not. Potential customers make choices based on these ratings. Not the organization itself is transparant but the perceived environment of the organization.

What do you think?

Categorieën
Reviews

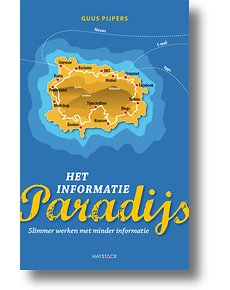
De weg naar het informatie paradijs

De afgelopen periode heb ik het boek het informatie paradijs van Guus Pijpers gelezen. Dit boek geeft op een hele pragmatsiche wijze handvatten om de weg naar het informatie paradijs te vinden en wanneer je het paradijs gevonden hebt hoe je in het paradijs jouw weg kan vinden.

Guus maakt op een hele makkelijke en toegankelijke manier duidelijk dat informatie in deze economie onontkoombaar is. Er is steeds meer informatie dus de vraag hoe we de juiste informatie tot ons kunnen nemen wordt steeds relevanter. De lezer krijgt ten eerst inzicht in wat informatie precies is en dat vorm en inhoud van informatie minstens net zo belangrijk zijn. Met behulp van een aantal vragen krijgt de lezer inzicht in zijn eigen informatie behoeftes en gebruik. Het blijkt dat de gemiddelde mens veel op zoek is naar informatie en hij weet daarbij eigenlijk niet waarom hij of zij dit doet. Heel veel informatie die wij lezen heeft nauwelijks echte waarde. Guus geeft vervolgens een aantal manieren om informatie te negeren en beter tot je te nemen. Daarnaast krijgt de lezer ook veel praktische voorbeelden hoe hij informatie beter kan communiceren. Dit alles wordt duidelijk gemaakt met een groot aantal praktische voorbeelden, onder andere uit de gezondheidszorg.

Het boek leest erg prettig en je krijgt het gevoel dat je Guus het boek hoort vertellen. Persoonlijk vond ik dit heel prettig maar ik kan me voorstellen dat niet iedereen dit even prettig vindt. Het boek is te bestellen op managementboek.nl.

Categorieën
Content Management

Infographics are out of control

This year to date the stream of infographics seems to be out of control. Every day there is a new infographic that tries to explane some phenomenon. If I search twitter for #infographic I get 20 more results within 5 minutes! Again triggered by Juuso Koponen I feel that most of these infographics are not adding the value they should and could. Juuso posed that infographics should reduce data and junxtapose data. I would like to add that they should be visual attractive and recognizable. This makes the visual experience more profound, fun and adds to comprehension.

But most infographics comply with the first requirement. Mostly these infographics consist of a large number of sub-infographics, this means they actually try to cover a lot of different data. For these individual infographics they reduce data somewhat. These infographics do not add value and help comprehension by the reader because it actually takes a lot of time to understand the complete infographic. The usage of text in maybe half of all infographics actually supports my theory. The infographic is not self explanatory if you need more than a sentence of, lets keep it simple, 140 characters to make your point. So lets add another item to the list of requirements for a good infographic: 80/20 rule for visual/text data.

The complete list would be:

  • reduce data for emphasis
  • juxtapose data for comparison
  • beautify data for inspiration and recognition
  • use max 20% text to support the visual

What do you think? Do we need to simplify infographics to add value again?

Categorieën
Neuroscience

How neuroscience could make your presentations better

Today I had a thought about presentation and neurosciences. My main question was: how can neuroscience help presenters tell their stories better to an audience? I see two important things here. the first is using multiple visual slides for each sentence. If you want to do this you should use visuals only and maximum one word per slide otherwise people will lose speed. Secondly you can use these visuals to prime your audience for better comprehension.

During PICNIC Juuso Koponen talked about the speed of the brain interpreting information through different senses. Sight is much faster than hearing (as Juuso mentioned in his speech). This implies that your eyes are processing the information on your slides or prezi much and much faster than your audience can hear you talk. Speedreading in a way is all about using your subconscious or automated brain processes to read. Your eyes can read much faster without you using you ‘inner voice’.

The other angle is that you can use priming to show certain elements in a presentation before you actually mention this element. If you can do a test better if you think about a day in the life of Albert Einstein, you can influence your audience in the same way. Repeat certain images like a returning theme. Use images of happy people if you want the audience to like your ideas. If you want a decision use more red visuals (remember the ties of politicians in election time). Think about your conclusion and use a visual that supports that conclusion.

If you are in my next presentation beware of a lot of slides. An old colleague once used 100+ slides for a 15 minute presentation and left time to spare,so it can be done!

Thanks to lokiv7 for the nice picture on speed!

Categorieën
Reviews

PICNIC day three

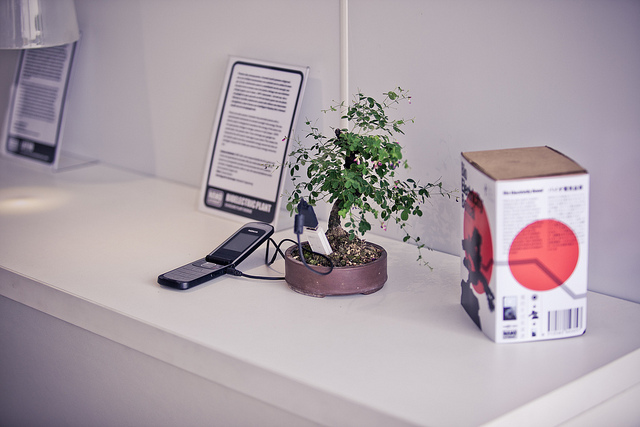
Yesterday was the third and final day of PICNIC. The picture (courtesy of PICNIC) was taken in the NANO supermarket and is a bonzai tree powering a cellphone. In this supermarket artists gave impression what could be done with nano technology. This wonderfull day started with the Open Data Breakfast. First Yuuso Koponen of the Aalto University in Finland kicked off with a very good presentation on information design & visualisation. One great insight was that visualisations enables the reader to choose the sequence of the information whereas in text the writer forces the sequence. Infographics are more pull than push so to say. Another important lesson to be learned was the speed in which your brain gathers data. Sights is the fastest with 10 Mbit/s while hearing is only 10000 bit/s. This explanes why visualisation can enable faster comprehension because it simply get’s in your brain faster. A third take-away I want to stress, is that visualisations should reduce data and to set the data side by side to enable easy comparison.

The second part of Open Data Breakfast was a workshop by Nokia on ideasproject.com. This site offers people the opportunity to submit ideas for using open government data. We worked on some very nice ideas. One of the ideas was the parking space problem. During the discussion the open311.org project and the Code for America project got mentioned. Both use open source to help municipalities open up their data and services to the public. During this discussion I wondered if citizens really want to be engaged in the government, business and people triangle. My idea is that as citizens we appointed government to take care of public service on behave of us. Why would we get engaged again?

After lunch  I really enjoyed the discussion on storytelling which was hosted by Dr. Beth Coleman. First was the director of Wasteland, a story about people living on a wastesite in Brasil. Second was Jeff Hull, the creator of the Games of Nonchalance for the Jejune Institute in San Francisco. Third was Euro Beinat, professor of context awareness in Salzburg, who talked about the currentcity project. Last but not least was Howard Goldkrand, creator of the Alternate Reality Game (ARGDexter. All showed remarkable ways to tell stories that change lives of the people in the story. Where a film the audience is not a part of the story but in the Games of Nonchalance and the Dexter ARG the audience participates. The Dexter APG had three tiers of participation from just viewing to full blown participation. These stories are told in a number of media at the same time because people all have different preferences to enjoy. It even got that far that in the game a game emerged between the makers and hackers who tried to hack the game. They were discovered and in a playfull way were engaged on their turf.

[vimeo http://www.vimeo.com/11705554 w=600&h=375]

Games of Nonchalance from Nonchalance on Vimeo.

During the break I witnessed the Appsterdam reward ceremony where an app won that enabled, again, to find free parking spaces. This seems to be a big issue in cities of all kinds and especially in Amsterdam.

The last session was about the business case for cities.  The session started out really great with Isis Spuijbroek, creative strategist for the City of Rotterdam. She gave us some insight in the way a city works and what it’s role is. I really liked the metaphors of businesses that Rotterdam could be. The presentation by Auke Ferwerda showed some insight in incubators and the effort to lower risk and a higher success rate. The combination of these speakers, in my opinion, did not make a business case but was interesting.
Categorieën
Reviews

PICNIC day two

Today was day two of PICNIC and another great day, maybe not as great as yesterday but never mind! The weather had improved tremendously over night. The day started with the Vodafone Mobile Clicks presentations. After a short delay and an introduction that was a little bit to long they kicked off with Wunderlist and Frogtek. Both were clearly startups in a more mature phase indicating the level was high. Wunderlist is a task management app for a number of platforms. This app already has a large fanbase and a number of mentions on prominent media! Frogtek is a service for small shop owners in developing countries to help run their businesses more efficient. Frogtek was my favorite because for me it was more innovative than a task management app. I did not stay tuned for the other candidates but the prize money will be rewarded tomorrow.

After lunch I sat in on a discussion about database cities and urban stories. The panel consisted of some great minds from the US and The Netherlands on this topic. Combining the data that cities are generating and augmenting this into the real world will shape the urban stories that make culture. A nice art example is The Catalogue made by Chris Oakley in 2004, where he envisions a world where tremendous amounts of data are combined. The internet of things comes into play. This is a big theme of PICNIC this year. The internet of things will be combined with social media (the internet of people?), ambient intelligence and mobility to improve life in cities. The discussion ended with the thought that although technology is great, people that are interacting with each other is the real stimulus for creativity and knowledge sharing.

My day ended with two great talks by Charles Landry and Victor van der Chijs from OMA. One of the thoughtfull questions by Charles was why people asked what the Zuidas is but the NDSM area is completely clear. The zuidas ,nice name for a financial district with international aspirations 😉 costed 2 bilion euro’s, where the NDSM island started with a briefing on the feel and culture of the area. Victor talked about the dimise of the creative class. Inspired by Richard Florida he made a case for creative class to team up with other the other promising sectors in The Netherlands to add value. An example is the Energy Roadmap 2050 to create an european powergrid.